Decision Trees: How They Work and Practical Examples
By 2026, 75% of Fortune 500 companies will apply decision intelligence, including decision networks, boosting their competitive strength. This tool in machine learning is transforming how businesses tackle complex challenges. It's key in predicting customer behavior and optimizing supply chains, leading the way in predictive modeling across various sectors.
Decision trees are a data science and machine learning model to make decisions or predictions. They work by asking a series of yes or no questions that gradually narrow down the possibilities. At each step, the model divides the data based on a specific rule, similar to following the branches on a tree. This continues until the model reaches a final answer, a category, or a number, depending on the task. It's a simple concept, but surprisingly powerful in practice.
Key Takeaways
- Top companies widely use decision trees for data-driven decisions.
- They provide a visual representation of complex problem-solving processes.
- Decision trees are fundamental in machine learning and predictive modeling.
- They can be applied to both classification and regression tasks.
- Understanding decision trees is crucial for developing more advanced ML algorithms.

Introduction to Decision Trees
Decision trees are a common and practical tool in supervised learning for classification and regression tasks. They work by breaking down a problem into a series of decisions, each represented as a branch in the tree. This makes them easy to follow, even for people who aren't deeply familiar with machine learning. Because of their straightforward structure, they're often one of the first models used when exploring a dataset. Despite their simplicity, they can capture surprisingly useful patterns in the data.
What makes decision trees especially appealing is how they mirror how humans tend to make choices: by narrowing down options step by step. They're widely used in healthcare, finance, and customer analytics, where transparent and interpretable decisions matter. For instance, a doctor might use a decision tree to help diagnose a condition based on symptoms, or a bank might use one to evaluate loan applications. They can also be used as building blocks in more advanced methods, like random forests or gradient boosting.
Definition and Basic Concepts
A decision tree resembles a flowchart, with each internal node representing a test on an attribute. Each branch shows the test's outcome, and each leaf node holds a class label or a numerical value. The path from root to leaf illustrates classification.
Historical Background
The idea behind decision trees has been around for decades, with roots in statistics, pattern recognition, and early computer science. One of the first formal methods came from work in the 1960s and 70s, when researchers began developing algorithms that could automate decision-making. A significant milestone was the creation of the ID3 algorithm by Ross Quinlan in 1986, which introduced a way to build trees based on information gain. This was followed by improved versions like C4.5 and later C5.0, which made the method more accurate and practical for real-world data. These developments helped establish decision trees as a standard tool in machine learning.
Importance in Machine Learning
Decision trees are vital in machine learning due to their clarity and adaptability. They handle numerical and categorical data well, making them perfect for various applications.
- Easily interpretable results
- Handle both classification and regression tasks
- Requires minimal data preparation
- Perform well with large datasets
Understanding decision trees offers insights into a key aspect of today's learning techniques. It's a foundation for more complex ensemble methods in machine learning.
How Decision Trees Work
Decision trees systematically break down a complex decision-making process into a series of more straightforward, easier-to-understand steps, allowing the model to classify data or predict values in a way that mirrors human reasoning. The process begins at the tree's root, where the algorithm looks at all the available data and tries to find the most effective way to split it based on a particular feature. From there, the tree branches out into different paths or nodes, each representing a decision point that narrows the possibilities until it concludes at a leaf node. Throughout this process, the model chooses splits that maximize how the data is separated, often using mathematical measures like information gain or Gini impurity to guide those choices. This step-by-step division continues until the tree perfectly classifies the training data or meets certain stopping criteria to prevent overfitting.
Here's a more detailed breakdown of how decision trees typically work in practice:
- The algorithm starts by selecting the best feature to split the entire dataset based on a specific criterion, like which split results in the purest groups or reduces uncertainty the most.
- Once the first split is made, the dataset is divided into smaller subsets, and the algorithm repeats the process on each subgroup, selecting the best features for further splitting.
- This recursive splitting continues, creating branches in the tree, with each internal node representing a decision based on a feature and each branch leading to another node or a leaf.
- When the tree reaches a point where it can no longer improve the splits, either because the data is perfectly separated, the subsets become too small, or the tree reaches a maximum depth, it assigns an outcome or prediction at the leaf nodes.
- The final decision tree can then be used to predict new data. Let's follow the branches from the root to the leaves, applying the same decision rules learned during training.
Node Types: Root, Internal, and Leaf
- Root Node. This is the very first node of the decision tree, where the entire dataset is considered. It represents the starting point of the decision process and is where the initial split happens based on the most crucial feature that best separates the data.
- Internal Nodes. These nodes come after the root and act as decision points that further split the data into smaller groups. Each internal node applies a rule or condition on a specific feature to divide the data, helping the tree narrow down possibilities step by step.
- Leaf Nodes. These are the terminal nodes at the end of the branches, where the final prediction or outcome is made. Leaf nodes don't split the data further; instead, they assign a class label in classification tasks or a numeric value in regression problems.
Splitting Criteria
Splitting criteria are the rules that a decision tree uses to decide how to divide the data at each node, aiming to create groups that are as pure or homogeneous as possible. The goal is to find the feature and the specific value to split on that best separates the data according to the target variable. Different splitting criteria are used depending on whether the task is classification or regression. For classification problems, standard measures include Gini impurity and information gain, which evaluate how well a split reduces uncertainty or mixes different classes. For regression tasks, criteria like mean squared error or mean absolute error are often used to minimize the difference between predicted and actual values.
- Gini Impurity. Measures how often a randomly chosen element from the set would be incorrectly labeled if it were randomly labeled according to the distribution of labels in the subset. Lower values indicate purer splits.
- Information Gain. Based on entropy, the reduction in uncertainty or disorder in the dataset is calculated after a split. The split that results in the highest information gain is preferred.
- Entropy. It represents the disorder or randomness in the data and is used mainly to calculate information gain.
- Mean Squared Error (MSE). Used in regression trees, it measures the average squared difference between the predicted and actual values. The split that minimizes MSE is chosen.
- Mean Absolute Error (MAE). Another regression criterion measures the average absolute differences between predictions and actual outcomes, focusing on reducing this value when splitting.
Information Gain and Gini Index
Information gain quantifies the entropy reduction post-data split on an attribute. It aids in choosing the most informative features. Conversely, the Gini index gauges data impurity. Both metrics strive to foster more uniform data subsets.
Decision trees leverage these techniques to classify data and predict outcomes. They're invaluable in customer segmentation, risk evaluation, and predictive analytics.
Classification vs. Regression Trees
Decision trees are categorized into two primary types: classification and regression trees. Each type is designed for specific prediction tasks and caters to different data types.
Classification Trees Explained
Classification trees operate with categorical data. They segment datasets into distinct classes based on the response variable, making them suitable for spam detection or disease diagnosis tasks. For instance, a classification tree might categorize emails as spam or not, using variables such as sender, subject line, and content.
Regression Trees Explained
Regression trees, on the other hand, handle continuous data. They are suited for prediction tasks where the target variable is numerical. For example, a regression could forecast house prices based on square footage, location, and number of bedrooms.
Key Differences and Use Cases
The primary distinction between these three types is their output. Classification trees predict class labels, whereas regression trees forecast numerical values. Here's a detailed comparison:
Both classification and regression trees are invaluable for various prediction tasks. Your selection hinges on the nature of your data and your objectives.
Building a Decision Tree: Step-by-Step Process
Creatree's decision tree requires several key steps, starting with data preprocessing. This phase ensures your data is clean and ready for analysis. You must handle missing values, encode categorical variables, and normalize numerical features. This preparation is essential for tree construction.
Feature selection is a vital step in building an effective decision tree. It involves choosing the most relevant attributes for your tree's decisions. Selecting the right features improves the tree's accuracy and reduces overfitting.
The tree construction phase follows, where you'll choose a splitting criterion. Standard methods include Gini impurity or information gain. These metrics help determine the best feature to split on at each node, maximizing the tree's predictive power.
As you build your tree, you'll engage in recursive partitioning. This process involves splitting the data into smaller subsets based on the chosen features. It continues until you reach a stopping condition. The result is a tree structure with nodes representing decisions and leaves containing predictions.
After construction, pruning helps prevent overfitting by removing unnecessary branches. This step ensures your tree balances accuracy with simplicity. It makes the tree more interpretable and generalizable to new data.
Finally, evaluate your tree's performance using accuracy, precision, or mean squared error metrics. This assessment helps refine your model. It ensures it meets your decision-making needs.
Advantages and Disadvantages of Decision Trees
Decision trees are widely used in machine learning because of their versatility and simplicity. They offer several benefits but also have limitations that require careful consideration.
Pros of Using Decision Trees
The main advantage of decision trees is their interpretability. They allow for easy visualization and understanding of decision-making processes. They can handle numerical and categorical data without preprocessing, making them adaptable to various datasets.
Decision trees are excellent at automatic feature selection, identifying key variables for prediction. They are robust to outliers and can capture complex, non-linear relationships in data. This versatility makes them suitable for various applications, from customer segmentation to risk assessment.
Cons and Limitations
Despite their strengths, decision trees have significant drawbacks. Overfitting is a primary concern, especially with deep trees. They can become overly complex, leading to poor performance on new data. Increased tree complexity also raises computational requirements and reduces model interpretability.
Decision trees are sensitive to small data changes, potentially resulting in different tree structures. This instability can impact their reliability. They also tend to create biased models when dealing with imbalanced datasets, favoring dominant classes.
Mitigating Drawbacks
Several techniques can be employed to address these limitations. Pruning helps control tree complexity and reduce overfitting. Ensemble methods like Random Forests combine multiple trees to enhance stability and accuracy. Careful feature selection and data preprocessing can also mitigate bias issues.
Understanding these pros and cons allows for the effective use of decision trees while minimizing their limitations. This balanced approach ensures optimal utilization of this powerful machine-learning tool in y "ur projects.
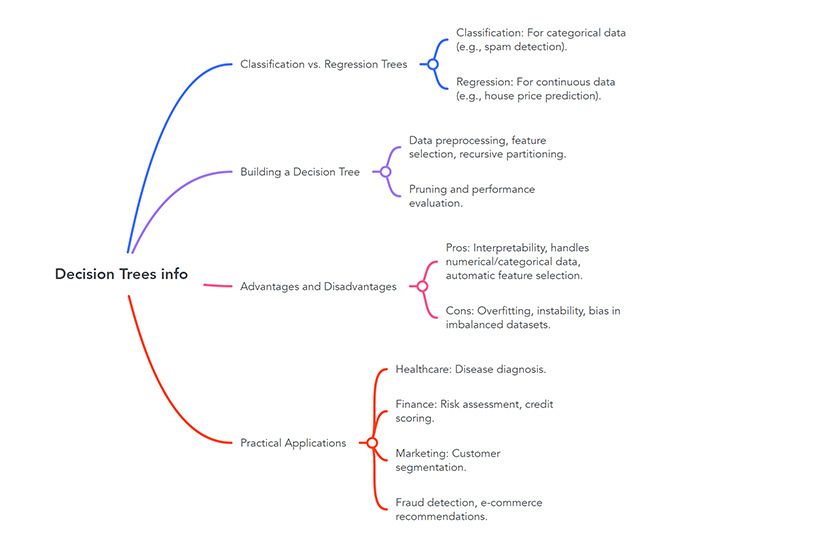
Practical Applications of Decision Trees
Decision trees are crucial in many fields. In healthcare, doctors use decision trees to diagnose diseases based on symptoms. For example, a doctor might start with fever as the root node and then branch out to various illnesses.
In finance, decision trees are used for risk assessment and credit scoring. Banks evaluate loan applications by looking at income, credit history, and employment status. This method ensures fair and consistent lending decisions.
Customer segmentation is another significant use. Marketing teams categorize customers based on demographics, buying habits, and preferences. This helps businesses tailor their strategies and boost customer retention.
Fraud detection systems heavily rely on decision trees. They analyze transaction patterns to identify suspicious activities. This proactive approach safeguards financial institutions and their customers.
In manufacturing, decision trees help control quality. They predict potential product defects based on production variables, allowing companies to maintain high standards and reduce waste.
E-commerce platforms use decision trees in their recommendation systems. These algorithms analyze user behavior and preferences to suggest products or content, enhancing the shopping experience and increasing sales.
[ Attach - "Decision trees are the Swiss Army knife of machine learning, versatile enough to tackle problems across industries."]
Decision trees' versatility makes them invaluable in data-driven decision-making. They are used in healthcare diagnoses, financial risk assessment, and more, and their applications continue to expand and evolve.
Decision Trees in Business Decision-Making
Decision trees are essential in today's business Let's. They enable professionals to make informed decisions by illustrating different paths and outcomes. This tool is vital for strategic planning, risk evaluation, and segmenting customers.
Strategic Planning
Decision trees are invaluable in strategic planning. They allow businesses to assess risks and rewards clearly, especially for non-standard datasets.
Risk Assessment
Decision trees are outstanding in risk assessment. They outline all possible outcomes, helping business owners grasp the risks and benefits of each choice. This detailed view supports better decision-making in pricing, promotions, and sales.
Customer Segmentation
In market analysis, decision trees are key for customer segmentation. They categorize customers based on various attributes, facilitating targeted marketing. This approach enhances marketing effectiveness by tailoring products to specific groups.
Many businesses employ decision tree software to create and analyze trees. Options range from free to paid, provided by companies like IBM, TreeAge, and SmartDraw. These tools make decision trees accessible for various business needs.
Implementing Decision Trees with Python
Python is a powerhouse for machine learning, especially with decision trees. Libraries like scikit-learn make it easy to build and train these models. Let's dive into using Python for decision tree analysis with real-world data.
The Balance Scale Weight & Distance Database, with 625 instances, is a prime example. Using scikit-learn, you can create a DecisionTreeClassifier. Set parameters like the "gini" criterion, max depth of 3, and minimum samples per leaf of 5. This configuration efficiently classifies the dataset's three classes: L (46.08%), B (7.84%), and R (46.08%).
Split your data into training (70%) and testing (30%) sets to set up your decision tree. Use features like Left-Weight, Left-Distance, Right-Weight, and Right-Distance for training. After training, evaluate the "you" model's performance. For example, similar implementations on the Iris Dataset and Breast Cancer Dataset reached about 94% accuracy. This highlights the effectiveness of decision trees in Python for various classification tasks.
FAQ
What are decision trees?
Decision trees are a form of supervised learning algorithm. They're used for both classification and regression tasks. The structure resembles a tree, with each node representing a decision or prediction.
What are the main components of a decision tree?
A decision tree has several key parts. The root node is the starting point. Internal nodes make decisions based on attribute values. Leaf nodes are the endpoints with predictions. There are connected nodes, showing the decision paths.
What is the difference between classification and regression trees?
Classification trees predict categorical variables, like "yes" or "no", while regression trees predict continuous variables like salary or temperature.
What are the advantages of using decision trees?
Decision trees are easy to interpret and handle various data types. They automatically select features and provide clear visualizations of decision-making processes.
What are some limitations of decision trees?
Decision trees can overfit and be sensitive to data changes. If some classes dominate, they may also create biased trees. Pruning, ensemble methods, and feature selection can address these issues.
What are some practical applications of decision trees?
Decision trees are used in healthcare for diagnoses and treatment decisions. In finance, they're used for credit scoring and risk assessment. They also apply in marketing, fraud detection, quality control, and recommendation systems.
How are decision trees used in business decision-making?
In business, decision trees help with strategic planning and risk assessment. They're used for customer segmentation and in making complex decisions. They provide clear models for these processes.
How can decision trees be implemented in Python?
Python's scikit-learn library makes implementing decision trees easy. The process involves preparing data, selecting a model, training it, making predictions, and evaluating performance.