How to Calculate Mean Precision: A Step-by-Step Guide
Mean Average Precision (mAP) emerges as a pivotal metric for this evaluation, crucial in object detection and information retrieval tasks. mAP is the preferred metric for assessing model performance at various recall levels. It's extensively utilized in benchmark challenges such as COCO, ImageNet, and Pascal VOC.
This metric evaluates both false positives and false negatives, offering a holistic view of a model's detection capabilities. To determine mAP, understanding concepts like the confusion matrix, Intersection over Union (IoU), precision, and recall is vital.
This guide will elucidate the process, aiding you in accurately evaluating your models and enhancing their performance.
Key Takeaways
- mAP is crucial for evaluating machine learning models in object detection tasks
- It considers both false positives and negatives for comprehensive assessment
- Understanding confusion matrix, IoU, precision, and recall is essential
- mAP is widely used in benchmark challenges like COCO and ImageNet
- Calculating mAP involves analyzing performance across different recall levels

Understanding Mean Precision in Machine Learning
Mean Precision is a key metric in evaluating machine learning models. It combines precision and recall to gauge how well a model identifies and ranks relevant items. This metric is essential for assessing model performance in various tasks.
Definition of Mean Precision
Mean Precision, or Average Precision (AP), measures the accuracy of positive predictions. It scores from 0 to 1, with higher scores indicating superior performance. The Mean Average Precision (mAP) averages AP scores across all queries or classes.
Importance in Model Evaluation
Mean Precision is crucial for evaluating model effectiveness. It sheds light on the trade-offs between precision and recall, aiding in algorithm fine-tuning. By examining the precision-recall curve, you can see how varying confidence thresholds affect performance.
Applications in Object Detection and Information Retrieval
In object detection, Mean Precision assesses algorithms like Fast R-CNN, YOLO, and Mask R-CNN. It evaluates the overlap between predicted and actual bounding boxes using Intersection over Union (IoU). For information retrieval, it evaluates the effectiveness of search algorithms and recommendation systems.
| Application | Key Metrics | Importance |
|---|---|---|
| Object Detection | IoU, mAP | Evaluates bounding box accuracy |
| Information Retrieval | Precision, Recall | Measures relevance of retrieved items |
Grasping Mean Precision allows you to refine your machine learning models. By utilizing this metric, you can enhance performance across domains, from computer vision to search engine optimization.
The Fundamentals of Precision and Recall
Grasping the concepts of precision and recall is key to evaluating machine learning models. These metrics are vital for assessing the accuracy and performance of classifications across different scenarios.
Precision: Measuring Accuracy of Positive Predictions
Precision evaluates how well a model correctly identifies positive instances. It's the ratio of true positives to all positive predictions made. For instance, a model with 0.843 precision in predicting heart disease correctly diagnoses the condition 84% of the time when it predicts a patient has it.
Recall: Capturing All Relevant Instances
Recall reflects a model's effectiveness in identifying all relevant cases. It's the proportion of true positives to all actual positives. In the context of heart disease prediction, a recall of 0.86 signifies the model correctly identifies 86% of patients with the condition.
| Metric | Formula | Example Value |
|---|---|---|
| Precision | TP / (TP + FP) | 0.843 |
| Recall | TP / (TP + FN) | 0.86 |
| Accuracy | (TP + TN) / (TP + TN + FP + FN) | 0.835 |
The Precision-Recall Trade-off
The Precision-Recall trade-off is a critical consideration in model refinement. Increasing precision often results in lower recall, and vice versa. This dynamic is depicted through a Precision-Recall curve, aiding in the selection of the best threshold for a given task. For example, healthcare might prioritize recall to ensure no cases are missed, whereas security systems might focus on precision to minimize false alarms.
By comprehending these principles, you can effectively evaluate and refine your machine learning models for specific use cases. This ensures they meet the necessary standards of classification accuracy.
Components of Mean Average Precision (mAP)
Mean Average Precision (mAP) is a critical metric for assessing object detection models. It integrates several components to offer a thorough evaluation of performance. At its core, the confusion matrix sorts predictions into true positives, false positives, true negatives, and false negatives.
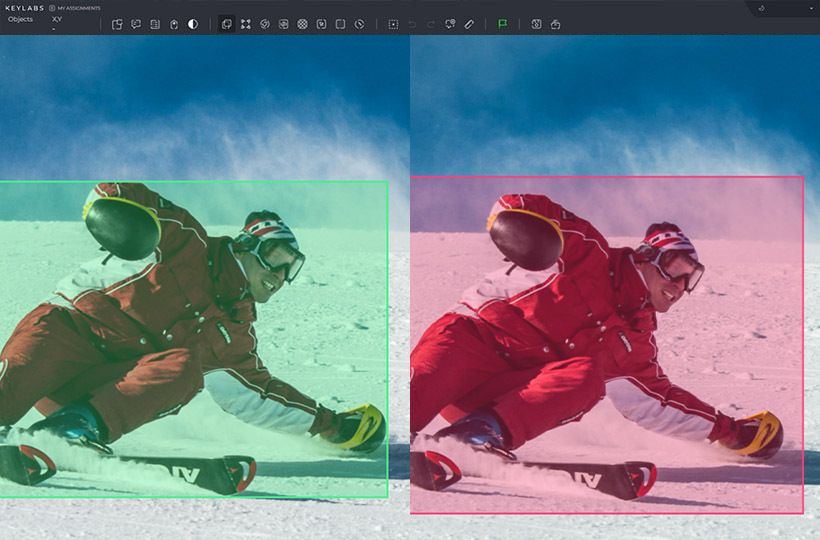
Intersection over Union (IoU) is essential in calculating mAP. It evaluates the overlap between predicted and actual bounding boxes. The IoU threshold decides if a detection is correct, affecting the mAP score.
The precision-recall curve is another crucial aspect. It shows the balance between precision and recall at different confidence levels. The area under this curve represents the Average Precision (AP) for a single class.
| Threshold | Precision | Recall | F1 Score |
|---|---|---|---|
| 0.2 | 0.5625 | 1.0 | 0.72 |
| 0.45 | 0.875 | 0.778 | 0.82 |
| 0.5 | 0.8 | 0.667 | 0.73 |
| 0.65 | 1.0 | 0.444 | 0.62 |
In challenges like COCO 2017, mAP is calculated by averaging AP scores across various object categories and IoU thresholds. This method offers a comprehensive evaluation of model performance across diverse scenarios.
Calculate Mean Precision: Step-by-Step Process
Calculating Mean Precision is essential for evaluating object detection models in computer vision. This process involves several key steps. These steps help assess model performance accurately.
Generate Prediction Scores
The first step is to generate prediction scores using your trained model. These scores represent the model's confidence in its classifications for each detected object.
Convert Scores to Class Labels
Next, convert these prediction scores into class labels. This typically involves setting a threshold value. Scores above this threshold are assigned to their respective classes, while those below are discarded.
Compute Confusion Matrix Elements
Using the assigned class labels, compute the elements of the confusion matrix. This includes True Positives (TP), False Positives (FP), and False Negatives (FN).
Calculate Precision and Recall Metrics
With the confusion matrix elements, calculate precision and recall metrics. Precision is computed as P = TP / (TP + FP), while recall is R = TP / (TP + FN).
Determine Area Under Precision-Recall Curve
Plot the precision-recall curve using the calculated metrics. The area under this curve represents the model's performance across different thresholds.
Measure Average Precision
Finally, measure the Average Precision (AP) by averaging precision values at different recall levels. Repeat this process for each class to obtain the Mean Average Precision (mAP).
| Step | Action | Outcome |
|---|---|---|
| 1 | Generate Prediction Scores | Model confidence values |
| 2 | Convert to Class Labels | Assigned object classes |
| 3 | Compute Confusion Matrix | TP, FP, FN values |
| 4 | Calculate Metrics | Precision and Recall |
| 5 | Plot Precision-Recall Curve | Performance visualization |
| 6 | Measure Average Precision | Final mAP score |
The Role of Intersection over Union (IoU) in Object Detection
Intersection over Union (IoU) is essential in evaluating object detection accuracy. It compares the overlap between predicted and actual bounding boxes. This metric, with values from 0 to 1, reflects how accurately bounding boxes are positioned.
To compute IoU, one must have the coordinates of both predicted and actual bounding boxes. The formula is straightforward:
IoU = Area of Intersection / Area of Union
A score of 0.5 is deemed satisfactory, while 1.0 signifies a perfect match. This metric is crucial for distinguishing correct from incorrect detections in evaluating object detection performance.
IoU thresholds are pivotal in calculating mean Average Precision (mAP). A standard threshold is 0.5, meaning predictions with an IoU above this are considered true positives. Adjusting this threshold can influence your model's evaluation performance.
In training custom object detection models, IoU is a critical metric. It evaluates algorithm performance and guides improvements in localization precision. By aiming to maximize IoU scores, you can boost your model's precision in identifying and locating objects in images.
Interpreting Mean Average Precision Results
Grasping the essence of mAP scores is vital for assessing model performance and enhancing it. Analyzing these scores reveals deep insights into how well your object detection model performs.
Benchmarking Model Performance
To gauge your model's performance, compare its mAP score with industry benchmarks. A superior mAP score reflects enhanced detection precision. For instance, an mAP of 0.73 in a specific object detection task could be deemed satisfactory, contingent on the task's complexity.
Comparing Different Algorithms
In evaluating algorithm performance, look beyond just mAP scores. Consider factors like speed, computational demands, and suitability for particular scenarios. Below is a comparative analysis of two widely used algorithms:
| Algorithm | Speed | Accuracy | Use Case |
|---|---|---|---|
| YOLO | Fast | Moderate | Real-time detection |
| SSD | Moderate | High | Precise object localization |
Identifying Areas for Improvement
To elevate your model's performance, concentrate on these critical areas:
- Reduce false positives and negatives
- Enhance bounding box accuracy
- Optimize for specific IoU thresholds
Achieving a perfect IoU score of 1.0 signifies ideal alignment between predicted and actual bounding boxes. Aim to elevate your model's IoU scores to boost overall mAP scores.
By meticulously interpreting mAP results, you can make strategic decisions about your model's efficacy. This approach is crucial for advancing object detection in vital applications such as autonomous vehicles and medical imaging.
Advanced Considerations in Mean Precision Calculation
Delving into advanced mAP calculation reveals complex scenarios that demand meticulous attention. Multi-class detection stands out as a significant challenge. Here, you must calculate the Average Precision (AP) for each class independently and then average these results.
Varying IoU thresholds are pivotal in a thorough model evaluation. Benchmarks like COCO employ multiple thresholds, spanning from 0.5 to 0.95. This method offers a comprehensive assessment of your model's performance at diverse overlap levels.
Class imbalance is another critical factor in advanced mAP calculation. To mitigate this, you can assign different weights to classes or utilize techniques like focal loss during training.
| Consideration | Approach | Impact on mAP |
|---|---|---|
| Multi-class Detection | Calculate AP per class, then average | More comprehensive evaluation |
| Varying IoU Thresholds | Use multiple thresholds (e.g., 0.5 to 0.95) | Robust performance assessment |
| Class Imbalance | Class weighting or focal loss | Improved accuracy for underrepresented classes |
By integrating these advanced considerations, you can enhance your mAP calculation process. This refined approach offers deeper insights into your model's performance. It helps pinpoint areas for improvement and optimizes your object detection algorithms more effectively.
Practical Examples of Mean Precision in Various Domains
Mean Precision is essential in numerous fields, providing crucial insights into how well models perform. It's used in various domains, highlighting its versatility and significance.
Information Retrieval Systems
In the realm of information retrieval, Mean Precision is vital for assessing search engine efficiency. It evaluates how effectively a system ranks relevant documents in search results. A high Mean Precision means a search engine consistently shows relevant web pages at the top.
Object Detection in Computer Vision
Computer vision heavily relies on Mean Precision to evaluate object detection models. It's crucial in benchmarks like PASCAL VOC and COCO. These benchmarks use Mean Average Precision (mAP) to compare models across different object classes. The calculation of Mean Average Precision combines precision and recall, affected by Intersection over Union (IoU) thresholds.
Recommendation Systems
Recommendation systems leverage Mean Precision to measure their success in suggesting items that match user preferences. A high Mean Precision shows the system consistently recommends relevant products or content.
| Domain | Mean Precision Application | Key Metric |
|---|---|---|
| Information Retrieval | Evaluating search result relevance | Average Precision (AP) |
| Computer Vision | Assessing object detection accuracy | Mean Average Precision (mAP) |
| Recommendation Systems | Measuring suggestion relevance | Precision at k (P@k) |
These examples show Mean Precision's vital role in evaluating and improving machine learning models across various fields. By grasping and applying this metric, you can boost the performance of your systems in information retrieval, computer vision, and recommendation tasks.
Summary
Mean Precision importance is paramount in machine learning and model evaluation. This metric offers a thorough assessment of model performance by evaluating both precision and recall across different thresholds. The calculation of mean Average Precision (mAP) is essential for assessing models in object detection and information retrieval tasks.
When discussing precision, it's standard to report the mean value along with the range or average deviation. For example, a precision of 12.4±0.88 provides a clear insight into the model's performance. The F1 score, which balances precision and recall, offers a single metric for evaluating models effectively.
FAQ
What is Mean Precision (or Average Precision) and why is it important?
Mean Precision, or Average Precision (AP), is a metric that evaluates model performance by combining precision and recall. It's crucial in object detection and information retrieval tasks. This metric assesses how well a model identifies relevant items and ranks them correctly.
How is Precision different from Recall?
Precision gauges the accuracy of positive predictions, whereas recall measures the model's ability to find all relevant instances. Precision is the ratio of true positives to all positive predictions. Recall is the ratio of true positives to all actual positives. There's often a trade-off between these two metrics.
What are the key components used to calculate Mean Average Precision (mAP)?
Mean Average Precision (mAP) uses several components: the confusion matrix, Intersection over Union (IoU), precision, recall, and the area under the precision-recall curve. These elements help evaluate the accuracy of bounding box predictions.
How do you interpret Mean Average Precision results?
To interpret Mean Average Precision results, benchmark the model's performance against established standards. Compare different algorithms and identify areas for improvement. Higher mAP values signify better overall performance.
What is the role of Intersection over Union (IoU) in object detection and mAP calculation?
Intersection over Union (IoU) is vital in object detection. It measures the overlap between predicted and ground truth bounding boxes. IoU is the area of intersection divided by the area of union. A higher IoU indicates superior localization accuracy, which affects mAP calculations.
What are some advanced considerations in Mean Precision calculation?
Advanced considerations include handling multi-class detection, varying IoU thresholds, and addressing class imbalance. For multi-class detection, calculate AP for each class and average them. Some benchmarks use multiple IoU thresholds for a comprehensive evaluation. Class imbalance can be tackled by weighting classes differently or using focal loss during training.
In which domains is Mean Precision commonly used?
Mean Precision is widely applied across domains. In information retrieval, it evaluates search engine performance. For object detection in computer vision, mAP assesses models like YOLO and Faster R-CNN on datasets like COCO and Pascal VOC. In recommendation systems, AP measures the effectiveness of item ranking for users.